edfinity #4c due 6-6-19

Referring to the histogram below, I'm asked in part (c):
What is the probability the representative above will have less than 10 years of service given that the person has less than 15 years of service?
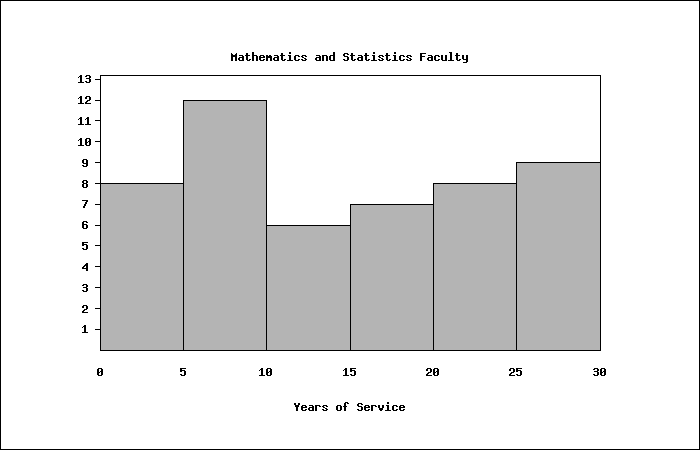
I figure that at <10 years of service I have a sum of (8+12), and at <15 years of service the sum is (8+12+6). This is 20/26=0.76, what am I doing wrong?


Comments
I edited your question to include the figure and complete the context. Note that many questions involve a randomization procedure so that your graph may not be the same as other peoples graphs.